
Photo By/Credit
Bureau of Reclamation
Date Shot/Created
08/10/2020Media Usage Rights/License
Copyrighted, All Rights Reserved - Used by Permission
Image
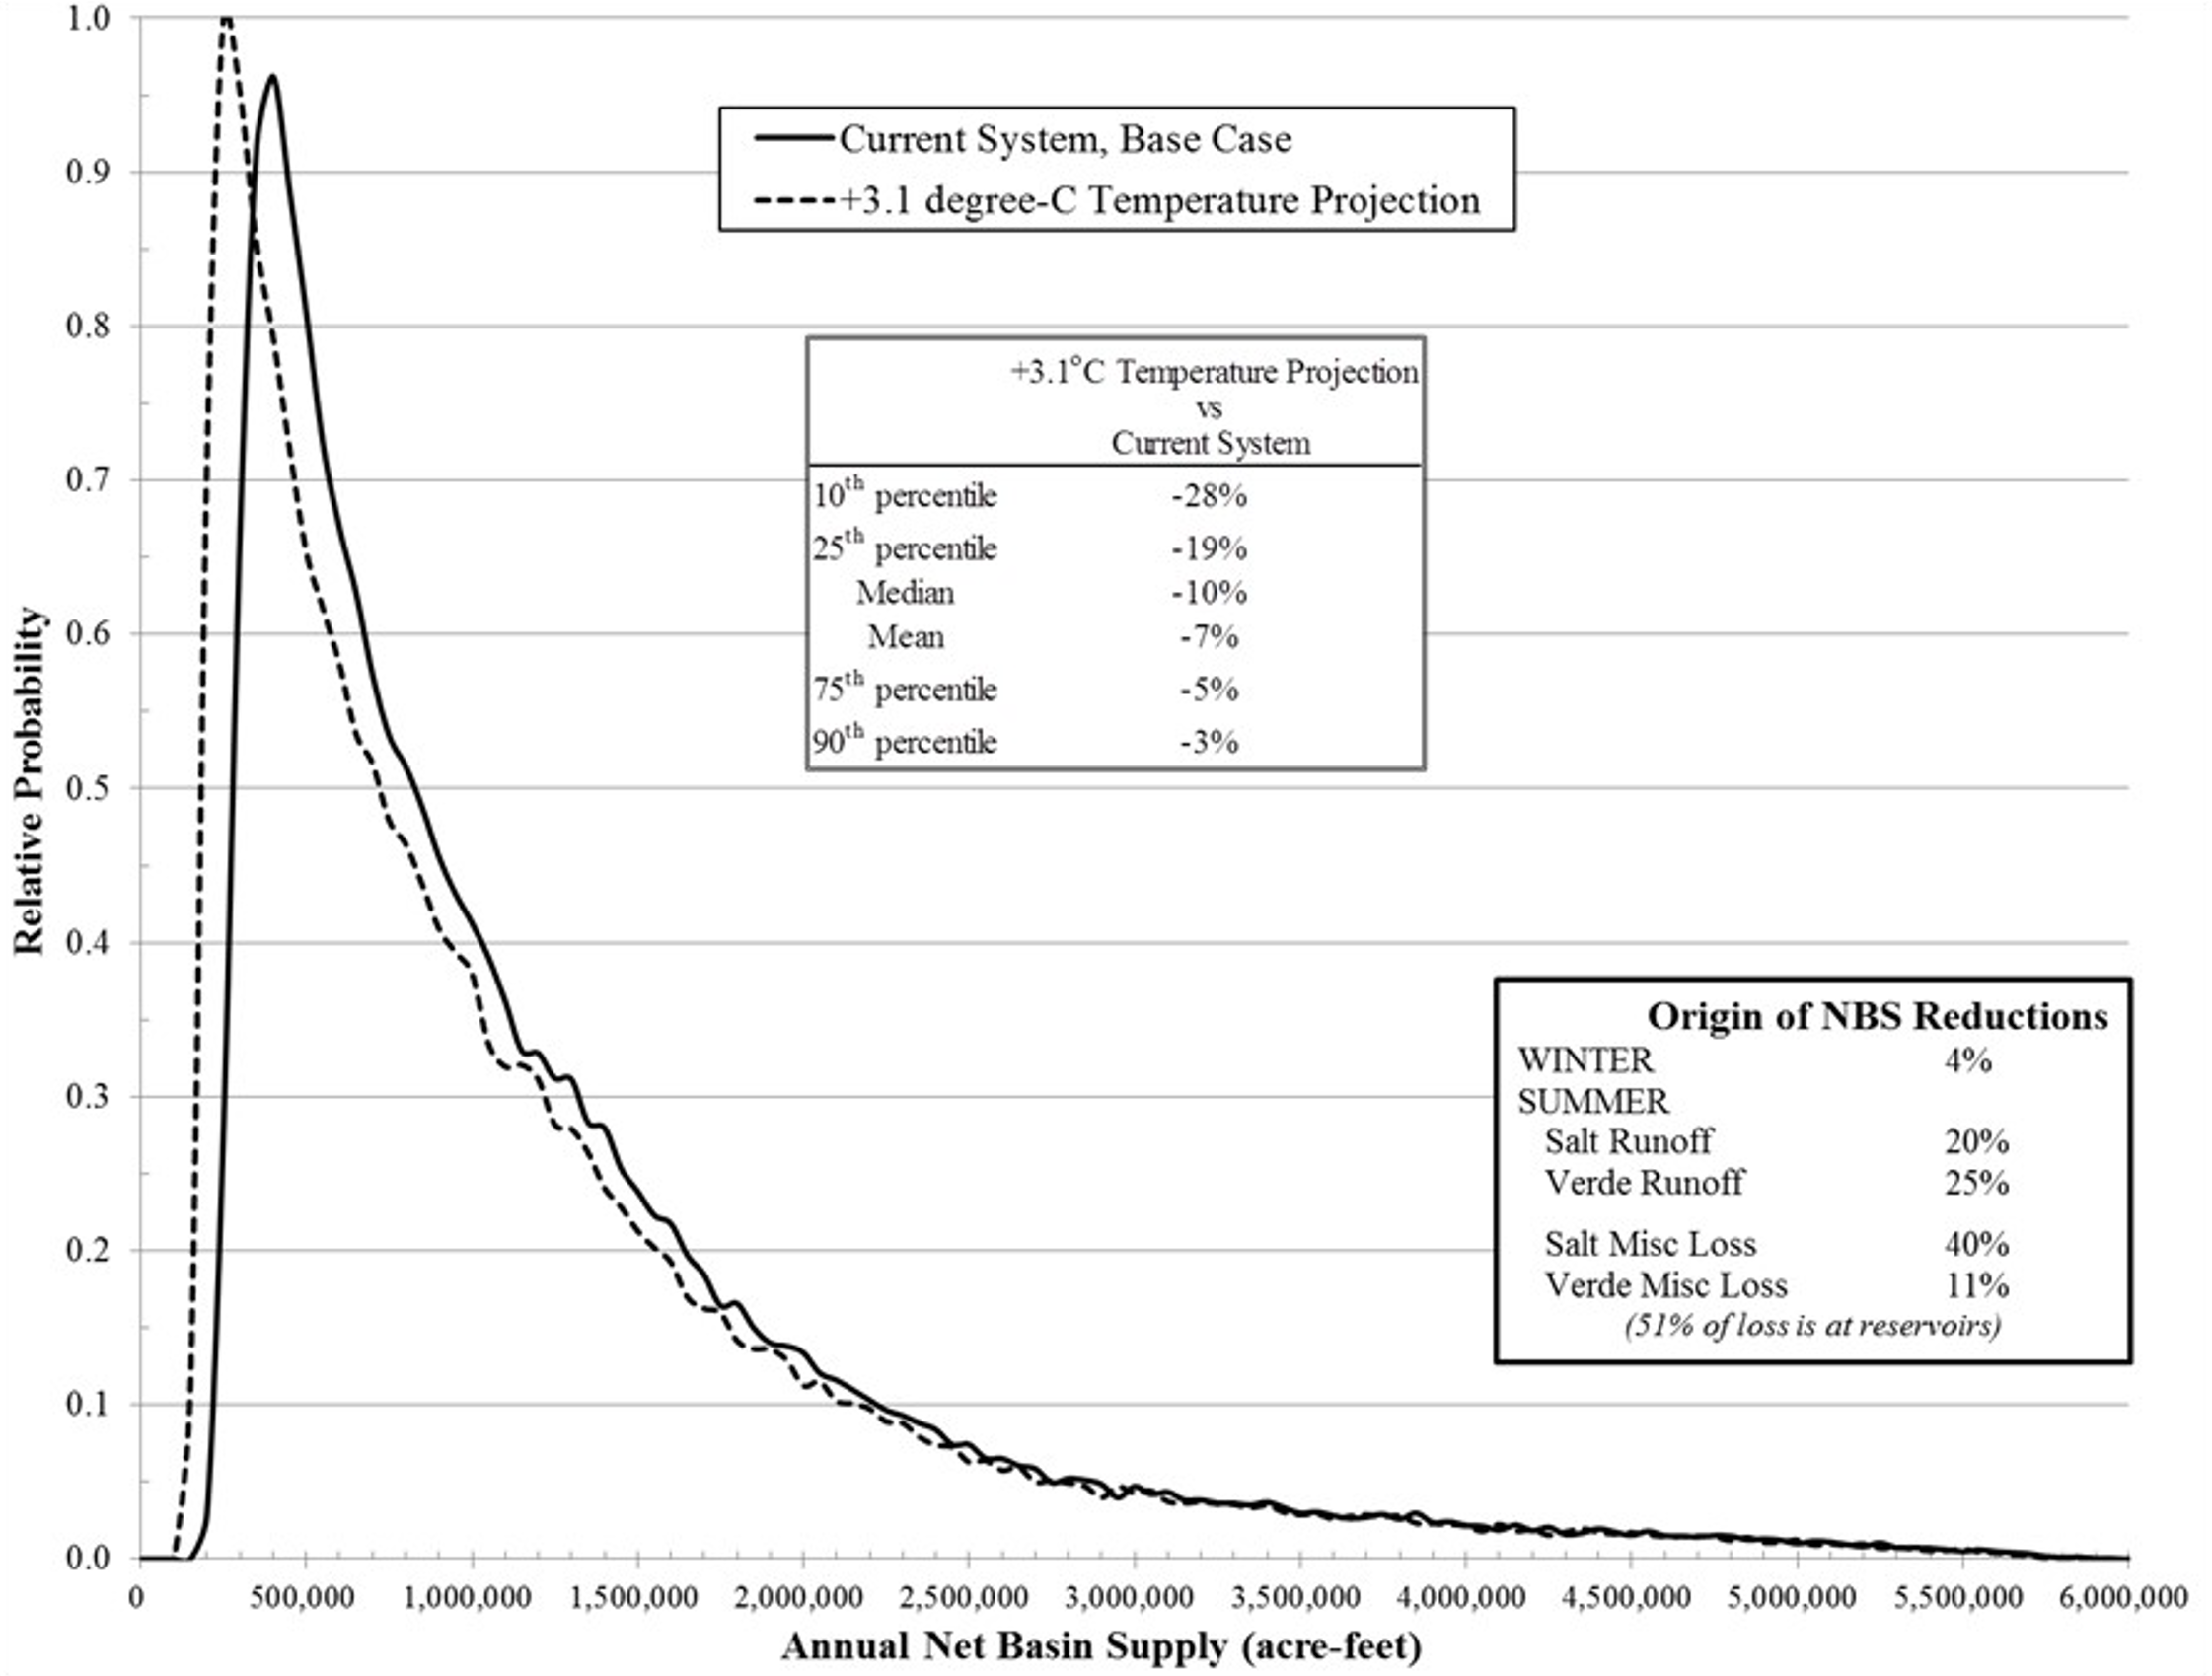
Figure 6-10: Annual NBS probability distributions for the current system and with a 3.1C temperature increase (NBS changes as a function of position within the distribution and origin of the reductions are tabulated).