The National Wetlands Inventory’s newly developed Difference Product Line provides information on where land cover is most likely to have changed since NWI Geospatial Dataset production to:
support effective investment in the dataset by allowing stakeholders to strategically target geographies in greatest need of updates
empower dataset users to make critical decisions regarding dataset suitability
enable more effective coordination with the NWI Program
Highlighting Change
Difference Products for the contiguous United States are displayed to the right, highlighting the following types of change:
wetland or deepwater habitat lost to impervious surface (top panel)
vegetated wetland change to open water (bottom panel)
open water gain on upland (middle panel)
In the figure to the right, areas that are gray have experienced less change whereas more intensely colored (red or blue) areas have experienced more. Patterns are largely controlled by the age of the NWI Geospatial Dataset and change trends. Thus areas that exhibit greater difference (i.e., change) may have older NWI data, more land cover change, or both. The figure panel to the top (right) highlights the association between loss of wetlands to impervious surface and development. Gain of open water may be associated with development but is also associated with changes in weather/climate, irrigation/farming and coastal marsh loss. Note that although there are concentrated areas of difference, the vast majority of the contiguous United States has not experienced this level of change and therefore has NWI data that better represent current land cover. Geographies with the greatest levels of difference could be prioritized for NWI updates.
Production Methods
Difference Products were created by comparing the NWI Geospatial Dataset with other federal land cover products on a per pixel basis (see below).
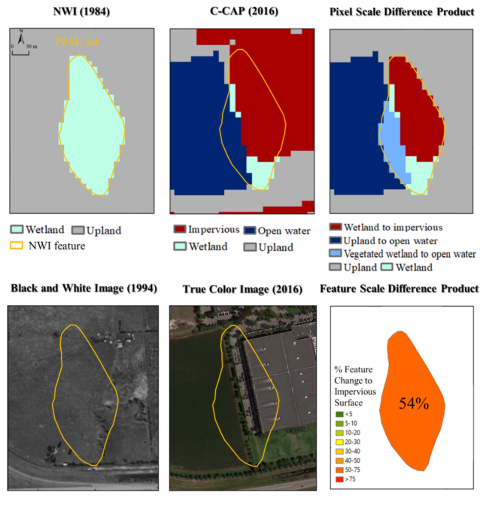
The figure on the left illustrates how Difference Products are created. The two primary product inputs are the NWI Geospatial Dataset (top left panel) and land cover data (top middle panel; National Oceanic and Atmospheric Administration Coastal Change Analysis Program [C-CAP] data used for this example). These are displayed next to a pixel scale Difference Product (top right panel) for an area near Houston, Texas. The Difference Product shows that the left side of a marsh has been replaced by open water, whereas the right side has been lost to impervious surface. This can be confirmed by viewing high-resolution imagery that show land cover when NWI data were produced (bottom left panel) compared with increased urbanization today (bottom middle panel). Note that the majority (54%) of the marsh has been converted to impervious surface (bottom right panel; feature scale Difference Product).
Methods used to Derive Difference Products
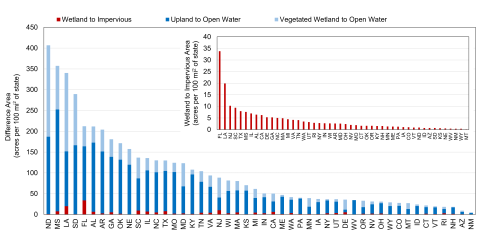
Difference Product Applications
The products are available at a variety of different spatial scales, including the watershed, census tract, NWI feature (polygon) and pixel scale. Watershed and census tract products can be used to target areas with the greatest need for NWI updates at the national, regional and state levels. Feature and pixel level data can be used to identify specific areas of change and may provide insights regarding change drivers. Summarizing difference at the state level (below) can help identify states in greatest need of NWI updates, along with the primary types of land cover change affecting wetland status. Note that most difference can be attributed to open water gain, either on uplands or wetlands, but impervious surface difference is more likely to be associated with wetland loss. Both types of change have implications for wetland functions.
Disclaimer
Since these data highlight differences, mostly land cover change, relative to NWI dataset production date the products should not be used to indicate wetland loss/gain trends at the national scale. Instead, they can be used to identify geographies that could be prioritized for NWI Geospatial Dataset updates, or to inform data use decisions.
Download Data
Census Track and Watershed Scale – Vector
Wetland to Impervious Surface – Contiguous U.S. (Census Tracts)
Upland or Vegetated Wetland to Open Water – Contiguous U.S. (Watershed)
Wetland to Impervious Surface – Coastal Contiguous U.S. (Census Tracts)
Upland or Vegetated Wetland to Open Water – Coastal Contiguous U.S. (Watershed)
NWI Feature Scale - Vector
Wetland to Impervious Surface – Contiguous (NWI Features)
Pixel Scale – Raster
Upland to Open Water- Contiguous U.S. (30M)
Vegetated Wetland to Open Water – Contiguous U.S. (30M)
Upland or Vegetated Wetland to Open Water – Contiguous U.S. (10M)
Upland or Vegetated Wetland to Open Water – Contiguous U.S. (10M; West)
Upland or Vegetated Wetland to Open Water – Contiguous U.S. (10M; Northeast)
Upland or Vegetated Wetland to Open Water – Contiguous U.S. (10M; Southeast)