

Location
States
TexasEcosystem
River/streamIntroduction
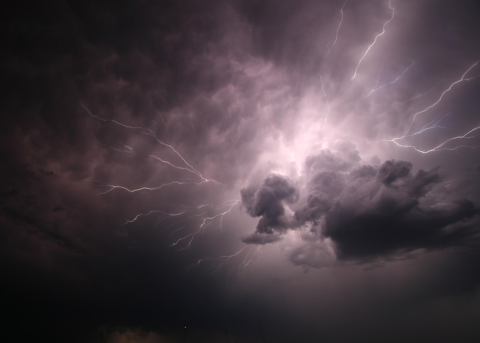
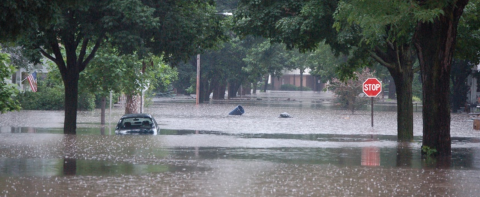
On Memorial Day, 2015, central Texas experienced wide-spread catastrophic flooding that resulted in loss of life and caused millions of dollars in damages. The flooding exposed the need for water resource managers, first responders, and the public to have real-time access to streamflow gaging station and weather information. In 2016, the U.S. Geological Survey (USGS) developed the Texas Water Dashboard to combine datasets produced by multiple agencies and display them in a single web-mapping application.
Key Issues Addressed
While many potentially viable and relevant datasets for hazard notification existed in 2016, many of those affected by flooding did not know where data existed on individual websites and portals to gather situational awareness during an emergency. Recent (post-2016) advances in technology gave USGS developers the capabilities to leverage these datasets and deliver them in a more efficient and timely manner.
The Dashboard provides the ability to simultaneously display multiple layers of weather on the same screen, enhancing the information contained in the individual data layers. This allows users to make critical decisions on the preservation of life and property during events such as floods or hurricanes. A mobile version supports these decisions in the field or during power outages, when resources are limited.
The interactive map addresses an issue the USGS has long-sought to conquer - the gap in knowledge by the general public in navigating the massive USGS database of water information, the National Water Information System (NWIS). By automatically querying the database for predetermined locations and parameters, the learning curve is shortened, and the querying process streamlined. It also expands the federal agency’s role in local and state-wide emergency management by giving a more modern platform to the information contained in NWIS.
By extension, finding this platform led to building the situational awareness before, during, and after a flood event that is key to safety and swift decision making. Expanding that awareness meant creating a holistic view of the various factors that lead to catastrophe by visualizing them together.
Project Goals
- Improve situational awareness of flash flood hazards in Texas
- Centralize multiple data feeds/streams from various agencies
- Utilize an iterative, human-centered User Interface (UI) development process to maximize effectiveness
- Enhance the visibility, scope, and impact of USGS water science
Project Highlights
New Avenues for Data: Adding user functionality to toggle layers for current streams, lakes, wells, water quality, and precipitation conditions at over 850 USGS observation stations in Texas provided a new outlet for the largely underutilized data observation stations collect.
The interactive map is accessible from desktop or mobile devices and delivers real-time streamflow and stream stage readings. The option to combine up to 15 other data layers to these stream conditions leverages each layer’s unique information inside a wider context to build situational awareness and characterize areas of high natural-hazard and risk from droughts, floods, and water security threats. Thematic base maps for topography, satellite imagery, streets, terrain, and monotone bases combine with complimentary datasets of Texas rivers, watersheds, and transportation networks to extend the Dashboard’s potential for customization and further contextualize the individual data layers.
Alongside the map, two fully autonomous Twitter feeds distribute water level and precipitation data: USGS TX FloodWatch (@USGS_TexasFlood) tweets a notification when any one of the 300 streamgages in Texas rises above the NWS-defined flood stage. USGS TX RainWatch (@USGS_TexasRain) tweets when rainfall exceeds 0.4 inches per hour at the same locations. The Dashboard allows the user to customize the feeds to show only those streamgages they deem relevant as well as provides the ability to plug the tweets into their own application.
Lessons Learned
Recognizing the Dashboard's audience and their data needs was crucial in delivering an effective solution. A diverse pool of end users required an emphasis on human-centered, end user design critical for successfully tailoring the app for each use case. Through constant cyclical engagement with cooperators and users, a design and management framework for finding solutions centered around the human perspective was formed.
Deciding which data to incorporate into the interactive map, and how to best deliver it, presented unique challenges that would require a comprehensive solution. The need to include the different perspectives of its users in these decisions became a lesson learned early in development and guided the creation of the Texas Water Dashboard through each iteration of building, deploying, testing, and evolving the application.
By gathering feedback from social media, applying tools to track usage statistics, and reporting out on lessons learned from previous challenges, the direction of design was led by listening to those who knew their needs best. Direct conversations with funders and data providers early and often in this cyclical process informed developers of the options at their disposal. This allowed them to better focus their efforts on delivering a highly useful product.
Next Steps
- In 2017, a scaled-down off-shoot of the Dashboard called Water On-The-Go was developed to give users easy access to current streamflow conditions across Texas and incorporates the USGS Water Alert program.
- Develop a National Dashboard application
- Expand to incorporate additional data into the Dashboard, including drone and LiDAR data, Large-scale Particle Velocimetry (LSPIV), and others.
Resources
- USGS Texas Water Dashboard
- USGS Texas Water Dashboard Website
- USGS Water-On-The-Go App
- USGS Water-On-The-Go Website
- USGS National Water Dashboard
- Furl et al. (2018). “Hydrometeorology of the catastrophic Blanco river flood in South Texas, May 2015.” Journal of Hydrology: Regional Studies, 15:90-104.
- National Weather Service
Contact
Daniel Pearson, Program Manager – NWIS Modernization, USGS: dpearson@usgs.gov
Case Study Lead Author
Nathan Pasley, Student Geographer, USGS, npasley@usgs.gov
Suggested Citation
Pasley, N.,K., (2020). “Delivering Real-time Water Hazard Information Through Human-Centered Design”. CART. Retrieved from https://www.fws.gov/project/real-time-water-hazard-information.
