An official website of the United States government
Here’s how you know
Official websites use .gov A .gov website belongs to an official government organization in the United States.
Secure .gov websites use HTTPS A lock ( ) or https:// means you’ve safely connected to the .gov website. Share sensitive information only on official, secure websites.
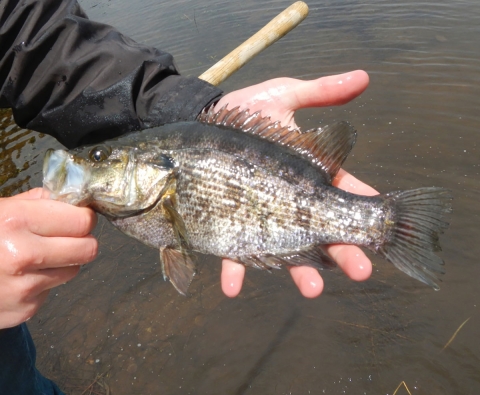
Sacramento perch are members of the sunfish family.
Stakeholder
California Department of Fish and Wildlife
Case Study Scenario
The California Department of Fish and Wildlife is looking to move Sacramento Perch back into California from Pyramid Lake in Nevada.
Objective
Identify sampling done by the National Wild Fish Health Survey done on Pyramid Lake to aid in the risk assessment of moving Sacramento Perch to California from Pyramid Lake in Nevada.
Results
Explore Data
Assessing the National Wild Fish Health Survey Database Web Application (URL) the search bar was used to find Pyramid Lake in Nevada by typing in the search box the search term “pyramid lake, Nevada.” Several options for pyramid lake, Nevada appear in a drop-down list. The first term, Pyramid Lake, NV, USA is selected and searched for.
With the lake located, the Hydrologic unit 8 watershed containing the lake is selected to preview the map pop up summary of the National Wild Fish Health Survey data within the watershed.
The map pop-up for the National Wild Fish Health Survey historical data summary watershed identifies the name of the watershed, Pyramid-Winnemucca Lakes, the pathogens detected within the watershed, Aeromonas salmonicida and Tricodina sp., total number of cases within the watershed, 9, and total number of fish tested within the watershed, 4598. Selecting the next feature arrow in the pop-up navigates to the map pop-up for the National Wild Fish Health Survey 2021-present summary watershed identifies the same watershed information as the previous pop-up, the pathogens detected within the watershed, no confirmed pathogens, total number of cases within the watershed, 2, and total number of fish tested within the watershed, 143.
The layer widget located in the top blue banner can be selected and the Watershed Reference Layer FWS National Wild Fish Health Survey Data 2021-Present can be unchecked to display only the historical data set with the confirmed pathogens.
Since pathogens have been detected in the watershed for the National Wild Fish Health Survey historical data, the navigate arrow button is selected next to the related table within the pop-up to view the case list. Each case is looked at by selecting the navigate arrow button next to each record in the pop-up list.
One option to narrow down the pop-up list of cases is to select the dropdown arrow located across from the related records: title and select the pathogendetected field to display all the cases by whether a pathogen was detected or not. The list can now be used to find the case’s with a pathogen detected and select the confirmed pathogen in the list to view the case record information in the pop-up window.
Since the pop-up list of cases is long, another option is to use the attribute table located at the bottom of the web application by selecting the open attribute table grey arrow button. Using the navigation arrows at the top of the attribute table tool, the FWS National Wild Fish Health Survey Related Table Historical Data table (last table) tab is selected since pathogens were detected in the historical database for the watershed of interest.
Select the options menu in the top ribbon of the table, select the Filter option. Select add expression in the filter dialog window. Select the HUC8Name field in the field drop-down list, keep the expression as is, click the gear setting and set the value list to unique, search and select the Pyramid-Winnemucca Lake and select the Ok option to set the filter in the table. The number of records reported at the bottom of the table changes to 160 records.
Export Data to .CSV File
Next, select the pathogendetected field and select the sort ascending option to pull the Aeromonas salmonicida pathogen detected records to the top of the table. Scrolling over in the table, the waterbody listed is Pyramid Lake and the state name is Nevada. The options menu is selected and the Export all to CSV is selected to download the filtered data for reference in the risk assessment.
Create Map from Data
To create a unique map, select the draw tool in the blue ribbon. Select the text option in the draw mode window. Enter in the text box: “Pathogens Detected: Aeromonas salmonicida, Tricodina sp., Number of cases: 9, Total Number of Fish Tested: 4598”. Next, change the font color to a bright color to stand out in the black basemap. Use your mouse to click to place the text below the watershed.
Select the print tool in the map ribbon, type in “Pyramid Lake” behind the default map title text. Make sure the map view is centered on the watershed and the text. Select the Print option in the Print window. When the exported map is ready to download the map will appear in the print option window, click on the map title to open the map in a new browser tab as a PDF. Download the map.
Use the latitude and longitude fields in the exported .CSV file to create a point map in a mapping software.
Outputs
Exported CSV table and map.
Outcome
The movement of fish does not occur due to multiple factors in the assessment.
Use the National Wild Fish Health Center Drupal page contact section for additional questions and information. Use the lab office name listed in the attribute table to guide who should be contacted.