
Photo By/Credit
Jennifer Isola/USFWS
Date Shot/Created
06/04/2024Media Usage Rights/License
Public Domain
Image
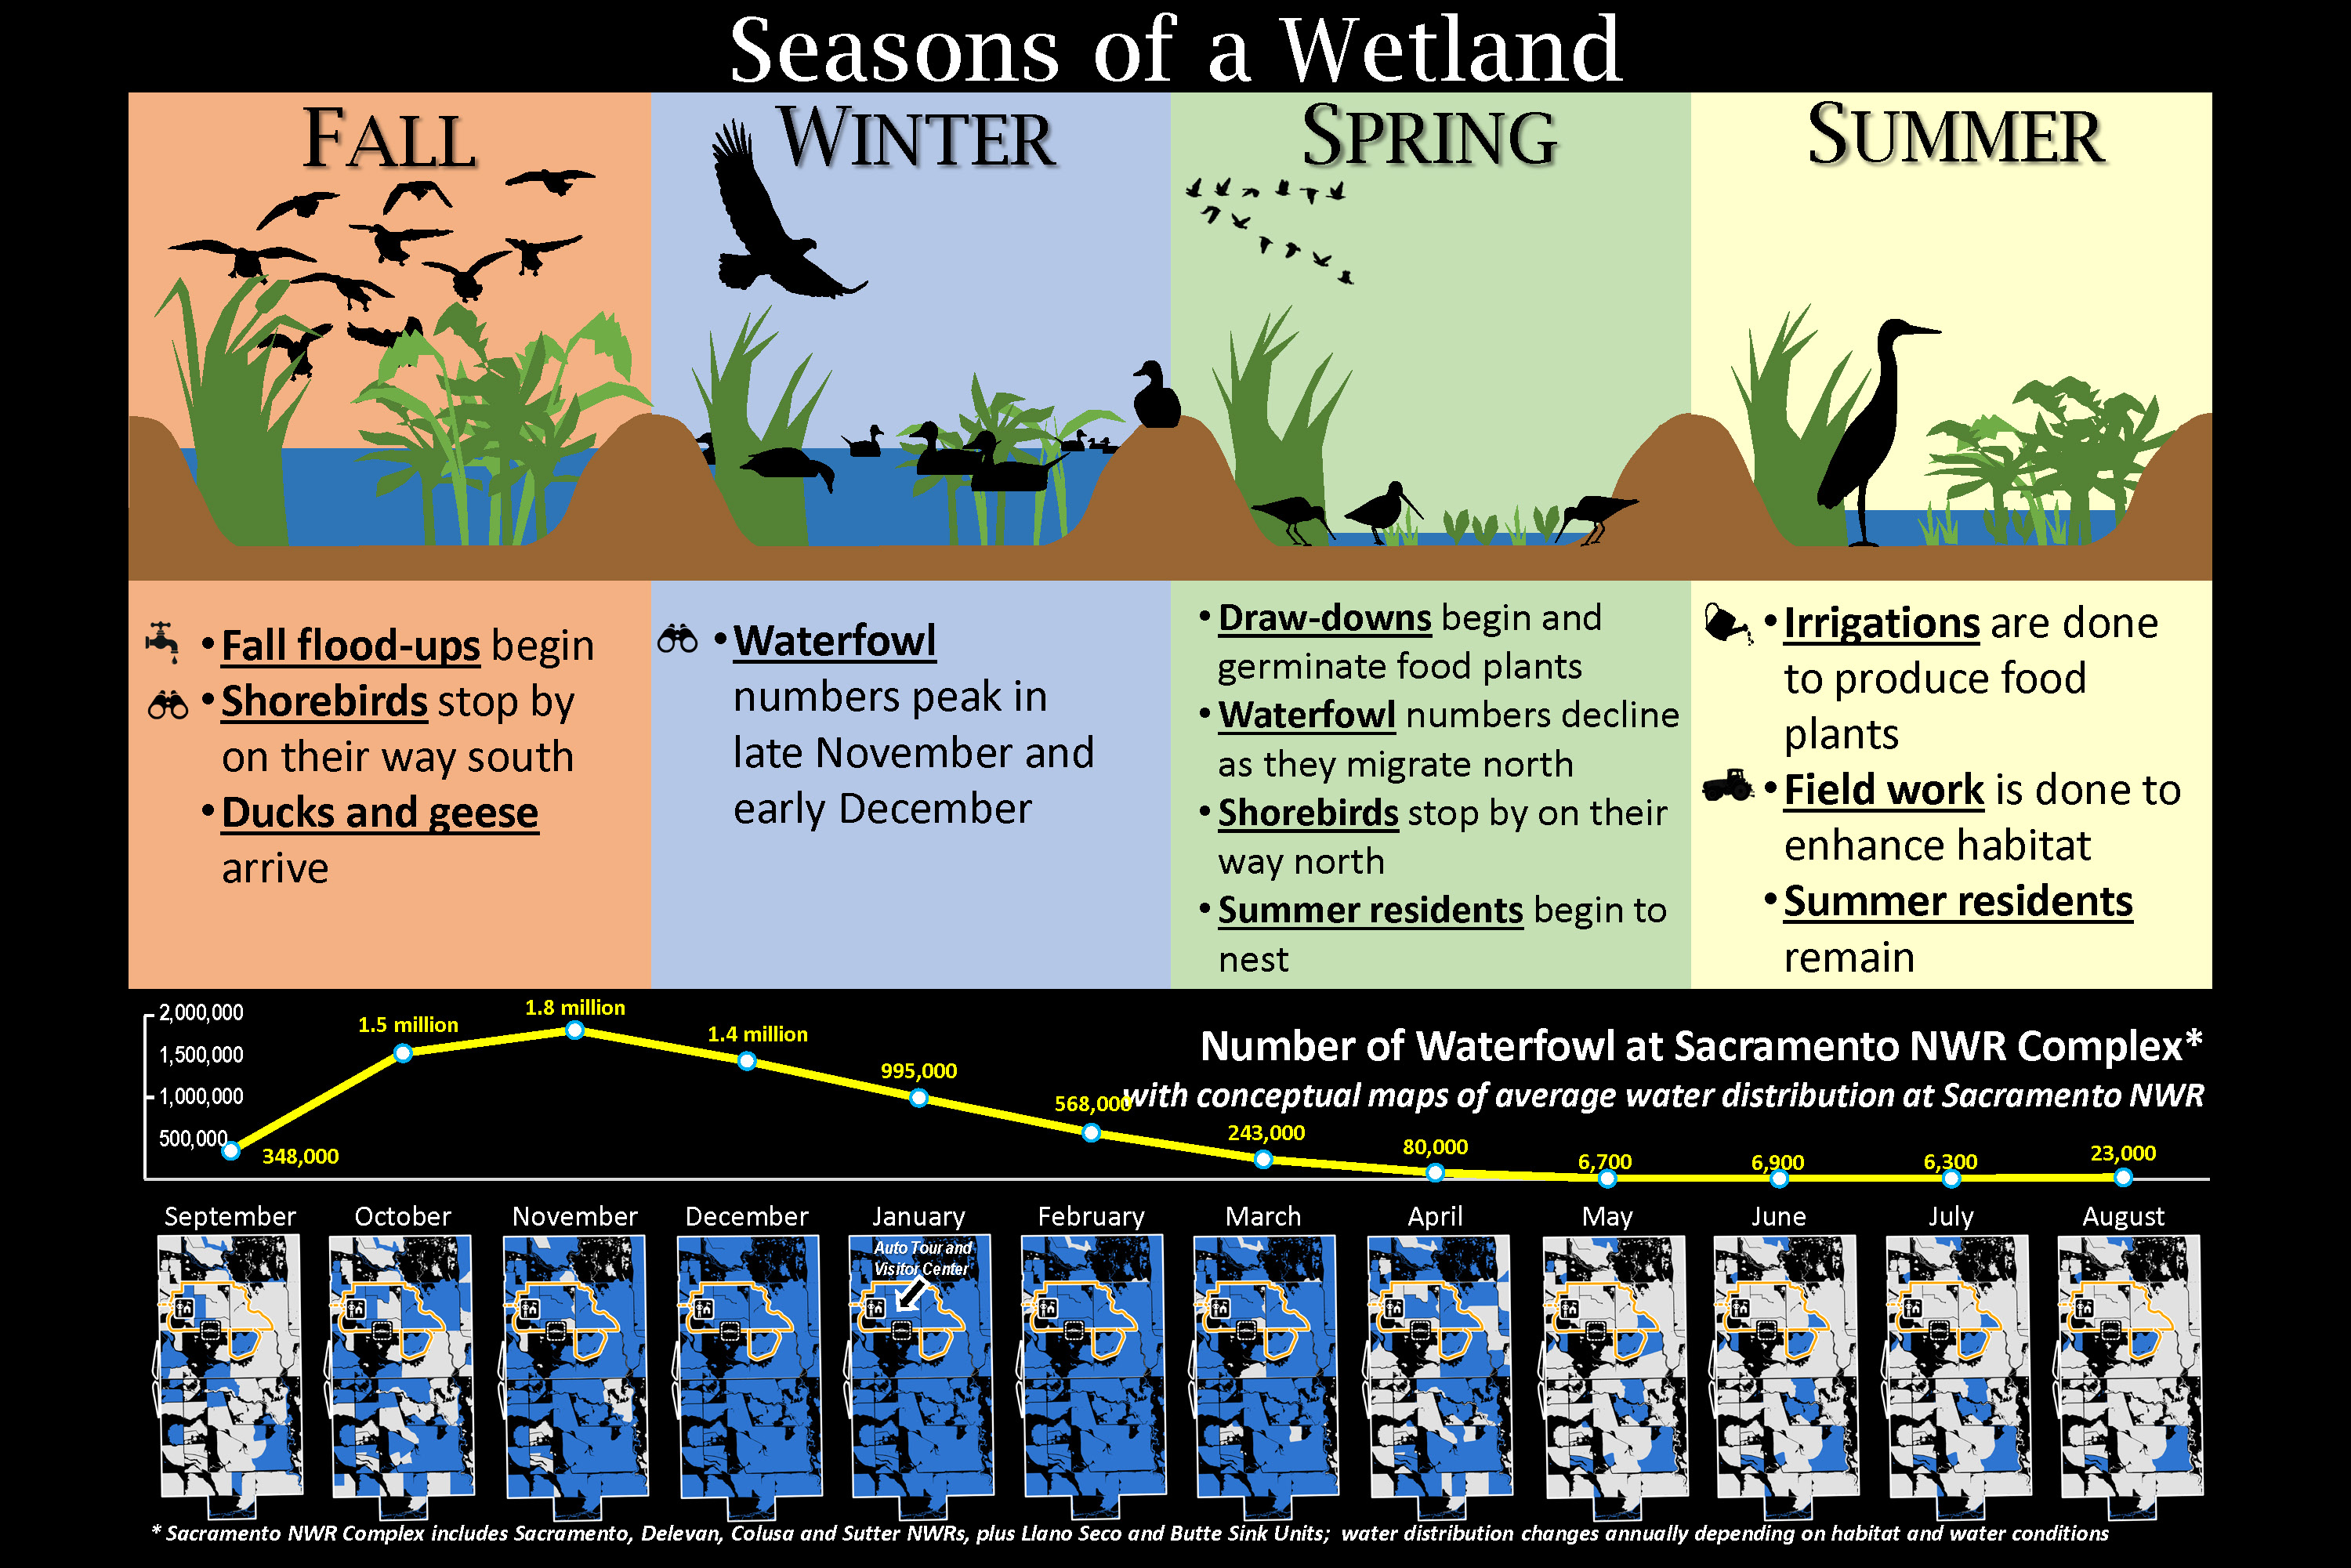
Seasons of a Wetland Illustration
Official websites use .gov
A .gov website belongs to an official government organization in the United States.
Secure .gov websites use HTTPS
A lock ( ) or https:// means you’ve safely connected to the .gov website. Share sensitive information only on official, secure websites.
Jennifer Isola/USFWS