The U.S. Fish and Wildlife Service National Wetlands Inventory (NWI) Program provides users with information on wetland and deepwater habitat location, extent, type and change to promote the understanding and conservation of America’s wetlands. The NWI Geospatial Dataset, commonly known as NWI maps, supports a wide array of applications, including climate change climate change
Climate change includes both global warming driven by human-induced emissions of greenhouse gases and the resulting large-scale shifts in weather patterns. Though there have been previous periods of climatic change, since the mid-20th century humans have had an unprecedented impact on Earth's climate system and caused change on a global scale.
Learn more about climate change resilience, infrastructure planning, habitat and species conservation, energy production and clean drinking water provision. The American public frequently relies on the dataset, as illustrated by nearly a million website views and 40,000 dataset downloads annually, but resources have not been available to regularly update the entire dataset.
To address this challenge the NWI Program is working with partners to leverage the best of different datasets and techniques, thus enhancing dataset utility and production efficiency. One example of this is NWI’s newly developed Difference Product Line, which provides information on where land cover change is most likely to have occurred since NWI data production. This product line: 1) supports effective investment in the Geospatial Dataset by allowing stakeholders to strategically target geographies in greatest need of updates; 2) empowers dataset users to make critical decisions regarding dataset suitability; and 3) enables more effective coordination with the NWI Program.
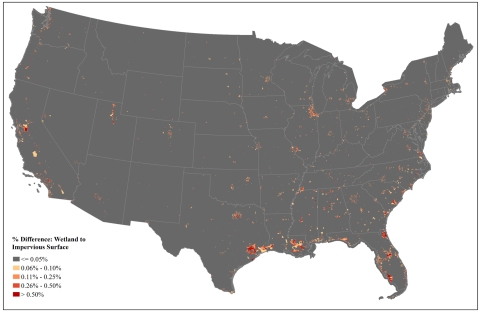
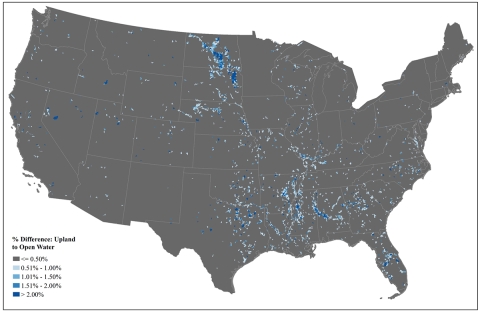
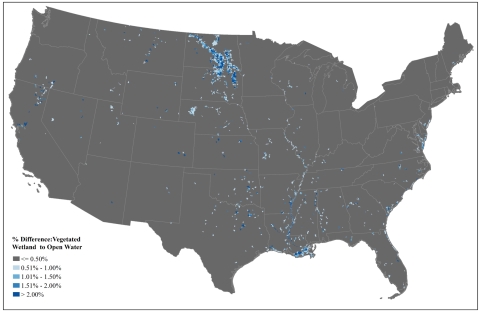
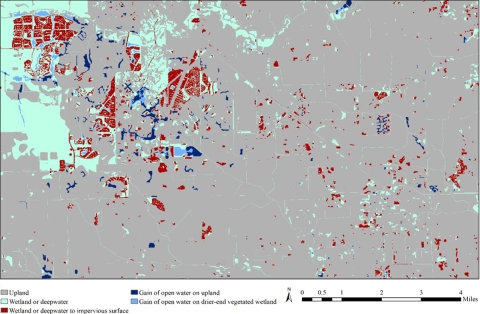
Difference Products were created, in partnership with the University of Maryland, by comparing the NWI Geospatial Dataset with other federal land cover products to identify areas where wetland or deepwater habitats are likely to have been gained or lost since Geospatial Dataset production. More specifically, areas are identified where the following changes are likely: 1) wetland or deepwater habitat lost to impervious surface; 2) vegetated wetland changed to open water; and 3) open water gained on upland.
In celebration of American Wetlands Month NWI is providing early access to this information for watersheds or census tracts throughout the contiguous U.S. Since these data highlight differences, mostly land cover change, relative to dataset production date the products should not be used to indicate wetland loss/gain trends at the national scale. Instead, they can be used to identify geographies that could be prioritized for NWI Geospatial Dataset updates, or to inform data use decisions. The products and related information can be accessed below.
Upland to Open Water Difference Product – HUC12 Watersheds
Vegetated Wetland to Open Water Difference Product – HUC12 Watersheds
Wetland to Impervious Surface Difference Product – Census Tracts
Stay tuned for more news on this product line, as well as more detailed products!