|
|
Drawing Tools |
Some of the most useful tools available in the Land Mapper are the Drawing tools. These tools provides the ability to add annotations - points, lines, polygons, and text - to the map view. You can set various properties, such as line and fill colors and styles, transparency, text color, and text size. You can also automatically include distance and area measurements as part of your line and polygon annotations.
Annotations can be very useful for creating custom, project-specific maps. For example, suppose you are developing a land exchange and need to investigate several alternatives. In this case, you might add annotations that coincide with private parcels, sections, townships, or geographic features such as ridge lines, river banks, lake shores, or coastlines. Your annotations can include their associated distance or acreage.
The Drawing tools offer many options. It is beyond the scope of this Help to describe every feature in great detail, therefore a general overview is given below.
The Drawing Tools
1) Click the Drawing Tools icon in the upper-left corner of the Mapper. The following will be displayed:
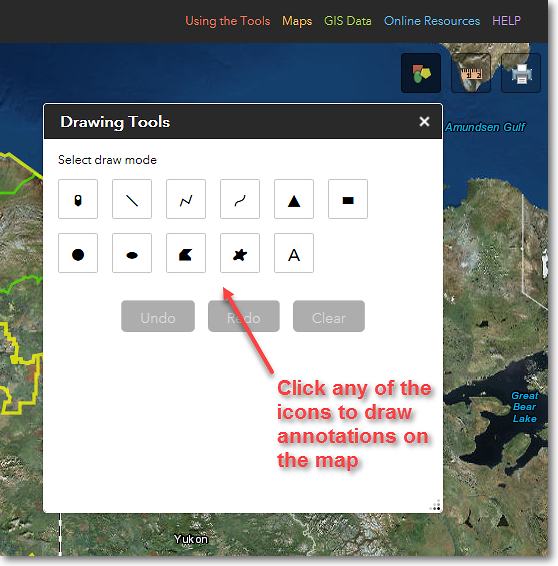
The Drawing Tools menu. Click any of the drawing tool icons to draw map annotations
Drawing Annotations and Measuring
Assume you need to determine the size of a lake for a project you're working on. You can do this using the Drawing Tools, as detailed below.
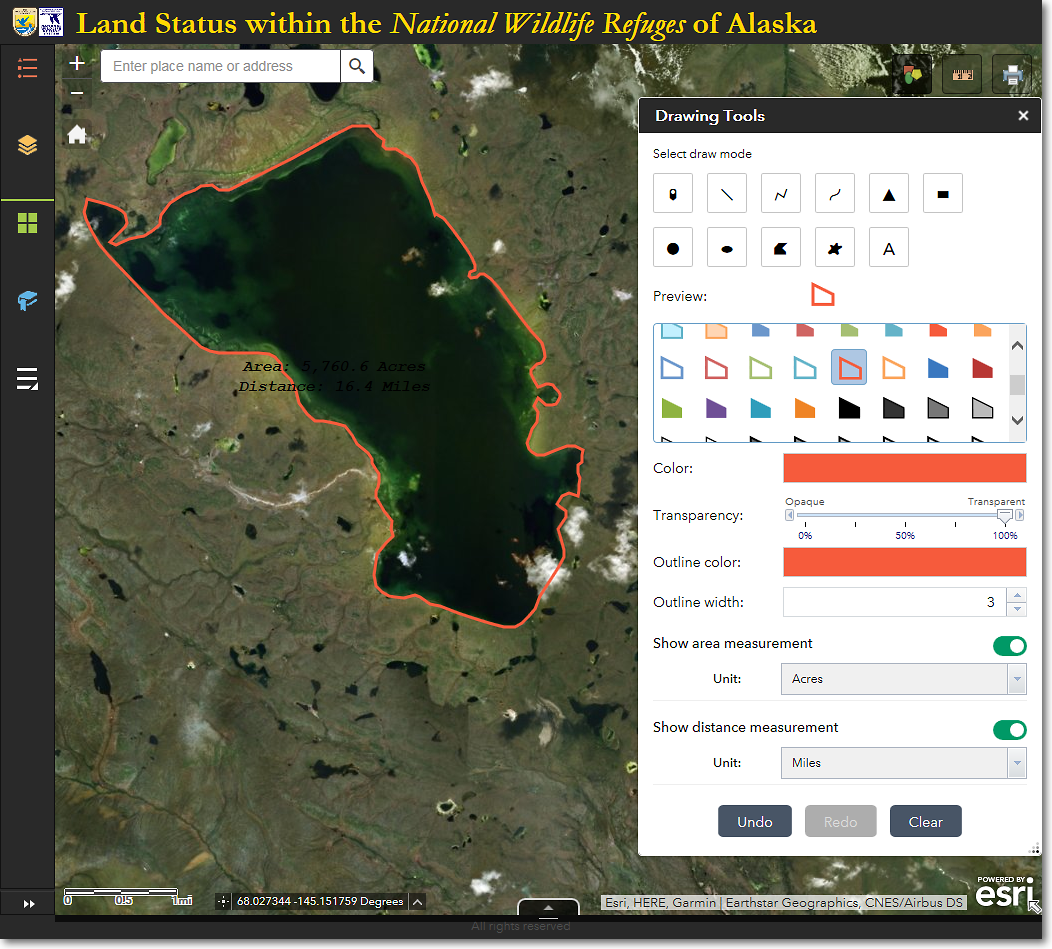
Illustration of using the drawing tools to highlight the shoreline of a lake and calculate its area and perimeter
1) Under Select draw mode, click the star-shaped, Freehand Polygon tool icon.
2) Under Preview, click one of the annotation styles.
3) Adjust Color, Transparency, Outline Color, and Outline Width as desired.
4) Put a check mark in the Show Measurements box.
5) Select your desired Area Units and Distance Units.
6) Draw the outline of the lake. In this example, the shoreline of the lake is highlighted with a red line and the measurements are displayed. The lake is 28.5 acres in size and has a shoreline length of 1 mile.
7) If you have the satellite image set as the basemap, it is highly likely that it will be difficult or impossible to read the measurements that are in black text. In order to solve this problem, you can temporarily switch to a different basemap, such as the USA Topo Maps basemap, as illustrated below.

After switching to the USA Topo Maps basemap, it is possible to read the measurements that were added to the polygon.
In this case, the lake covers an area of 5,760.6 acres and has a shoreline of 16.4 miles.
Experiment with the other drawing tools to add additional annotations to your map. You can use the Undo, Redo, and Clear buttons to manage your annotations.
|
|
User-added annotations are TEMPORARY Annotations that you add to the map are temporary. They are deleted from the Land Mapper when: •You delete them manually using the Undo or Clear buttons on the Drawing Tools menu. •Your clear your web browser's cache and use the Refresh or Reload feature of your web browser •You close your web browser |
|
|
Try different basemaps Depending on the basemap that you have displayed in the map, it may be difficult to read the measurements associated with your annotations. Unfortunately, the default - and unchangeable - text color is black. If you can't read the text, try switching to a different basemap. If none of the basemaps seems ideal, use the basemap that most closely fits your needs, then add your own text annotation for the measurements. The advantage of this method is that, when adding your own text, you can control the font, size, and color, making it much easier to get your desired result. |
The Region 7 Land Mapper was developed, and is maintained by, the U.S. Fish & Wildlife Service, Region 7, Division of Realty. Questions, comments,and suggestions should be directed to [email protected]
This page was last updated: Thursday, March 13, 2025