|
|
Attribute Table |
The Attribute Table tool displays information associated with various data layers. When you want to see detailed information about the various layers, this is the tool to use.
Accessing the Attribute Table
To open the attribute table, click the Up arrow that is located at the bottom of the Mapper window. The table will expand upward and show several rows. If the table takes up too much of your screen, or if you want to see more rows, move your mouse cursor over the top border of the table, then click and drag up or down to resize the attribute table.
![]()
Click the Up arrow at the bottom of the Mapper window to open the attribute table.
To quickly close, or minimize, the attribute table, click the Down arrow in the center of the bar.
Main Features of the Attribute Table
The Attribute Table tool is actually a container for multiple attribute tables. In other words, it shows information for many of the data layers in the Mapper. At the top of the attribute table are multiple tabs with the layer names. Each of these tabs shows the attribute table for that particular data layer. For example, the National Wildlife Refuge tab shows the attribute table for the National Wildlife Refuge layer. Simply click one of the tabs to switch to that particular attribute table.
By default, the attribute table is dynamic, meaning that it shows only the records for the features that are within the extent of the currently viewed map. Thus, as you pan around and zoom in and out in the map, the attribute table updates each of the individual data layer attribute tables to show the records for only those features which are visible in the map view.
Alternatively, the attribute tables can be switched to static mode. In this mode, the tables display all records within the various data layers, regardless of the current map zoom level or panning around in the map. To switch to static mode, click the Filter by map extent button that is located in the upper-left corner of the attribute table window.
Scrolling through the Attribute Table Tabs
The tables of 18 data layers are displayed as individual tabs in the Attribute Table tool. You will not be able to see all 18 tabs on your display at one time. In order to see additional tabs, you will need to scroll left and right. Refer to the screenshot below.
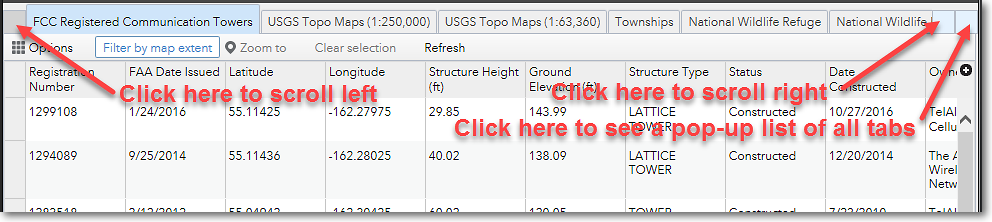
Click the blank tabs at the left and right ends of the Attribute Table tool in order to scroll left and right
Specific Functionality
In addition to the main features of the Attribute Table tool, various other functions are available. These are accessed by clicking Options button in the upper-left corner of the Attribute Table window. Below is a screenshot showing the Options popup menu.
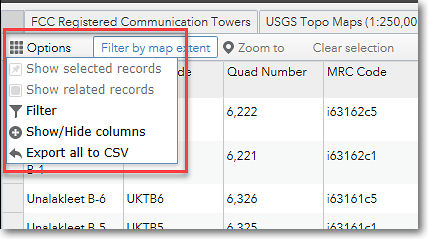
The Options popup menu, showing the various features that can be used
Selecting Individual Records
By default, all the features that are visible in the current viewing area for a data layer are displayed in the attribute table. If you want to focus only certain records in the attribute table, you can select those records. This is useful if you want to see only the selected records, zoom to them on the map, or export them to a file. To select a record, click on the blank space to the left of the first column. The record in the attribute table and it's corresponding feature in the map display will be highlighted with a cyan color.
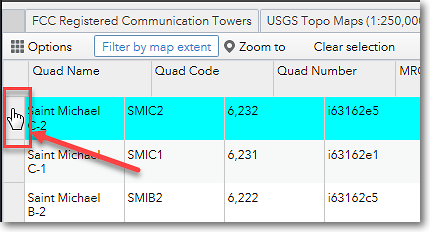
To select a record, click the blank space to the left of the first named column
To select multiple consecutive records, click the first record, then hold the Shift key and click the last record. All records from the first record to the last record will be selected. To select non-consecutive records, hold the Ctrl key and click the records of interest.
Options > Show Selected Records
After selecting a single record, or multiple records, you might want to see only those records in the attribute table. To do so, click Options > Show Selected Records.
Options > Show Related Records
Some data layers may have related records which provide more information about a record in the attribute table. Related records are stored in a separate database table and provide more detailed information for a parcel, such as the owner name. If a data layer has related records, the Options > Show related records command will be activated. Click Options > Show related records to view the related information.
Options > Filter
Another method of selecting records is to specify certain criteria. For example, if you want to see which wilderness areas are within Kenai NWR, you would first click on the National Wildlife Refuge Wilderness tab. Select Options > Filter, click Add expression, and specify NWR Name is Kenai, as shown in the example below.
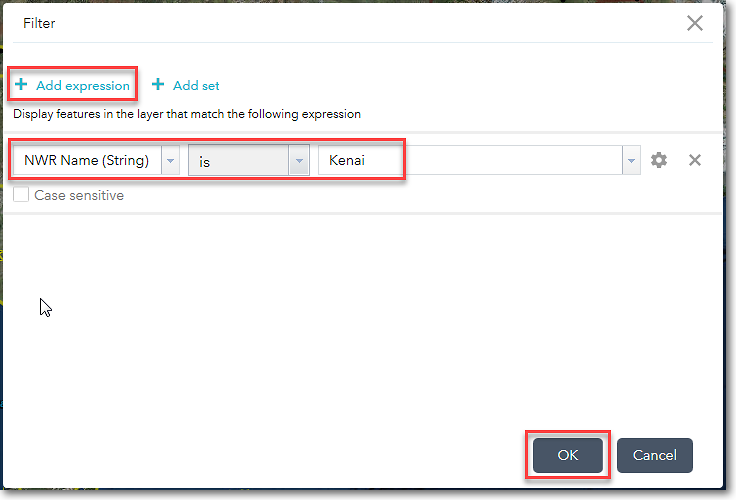
This filter expression selects the records for all the wilderness areas within Kenai NWR
Options > Show/Hide Columns
If you want to see only certain columns in a data layer's attribute table, click Options > Show/Hide Columns and then, in the op-up window, click the check box to the left of each field name to either show the column (check mark on) or hide the column (check mark off).
Options > Export to CSV
Select this option to export the records that are currently shown in the viewed attribute table to a comma-separated values (CSV) file. This is a generic file type that can be opened in many programs, such as Microsoft Excel. If you have selected some records, only the selected records will be exported to a CSV file.
Filter by Map Extent
By default, the attribute table shows records for only those features that are currently shown in the map view. However, if you want to see all of the records for a data layer, click Filter by map extent to unselect it. The attribute table will then dynamically update to show all records for the data layer, regardless of whether or not they ave visible in the map display. To again see only the records for the features that are visible in the map display, click Filter by map extent to turn it back on. Note that the Filter by map extent option works globally across all the various data layers that are shown in the attribute table.
Zoom To
If you want to zoom the map to a specific feature that is shown in the attribute table, first click on the record in the table to select it (selected records are shown with a cyan background). Then choose Zoom to at the top of the attribute table window.
Clear selection
This simply unselects any records that are selected in the attribute table.
Refresh
This just simply reloads the records in all the data layer attribute tables.
Records in columns are sortable
You can sort the records in each column of an attribute table by clicking on the column name, then select a sort option from the pop-up menu.
Get Statistics for Records
You can get basic statistics for the records that are currently shown in a data layer's attribute table. Note that statistics are available only for numeric fields, and not for text fields. To get statistics, click on a column heading and select Statistics from the pop-up menu. Note that you can't get statistics for only the records that you might have selected; the statistics are for all of the records that are currently shown in the data layer's attribute table.
Columns are re-sizeable
If a column is too narrow to see the entire values, you can make it wider. Move your cursor to the column header and drag the dividing line between columns left or right to re-size.
|
|
Related records are not exported to CSV files When you use the Export to CSV file feature, only the records in the attribute table are exported. Information in related tables will not be exported. |
The Region 7 Land Mapper was developed, and is maintained by, the U.S. Fish & Wildlife Service, Region 7, Division of Realty. Questions, comments,and suggestions should be directed to [email protected]
This page was last updated: Thursday, March 13, 2025